$cluster and $node with actual values or use dashboard template variables.
Low GPU utilization
Compare GPU utilization, power, CPU pressure, I/O pressure, and memory pressure.
GPU throttling
Check GPU temperature, HBM temperature, and thermal violation counters.
ECC and XID errors
Identify uncorrectable errors, row remap failures, and critical XID codes.
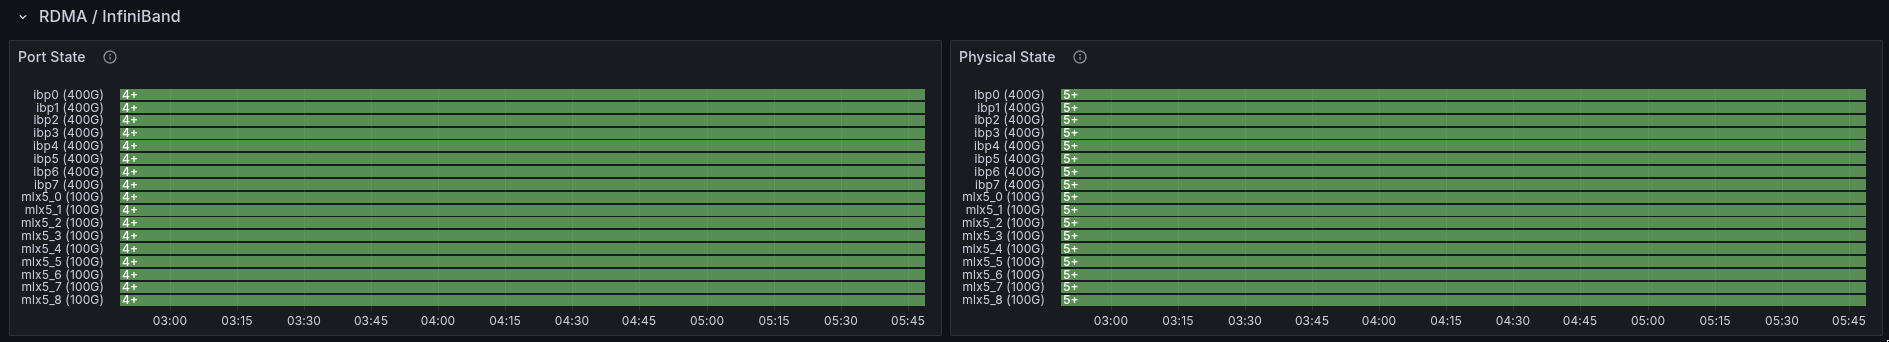
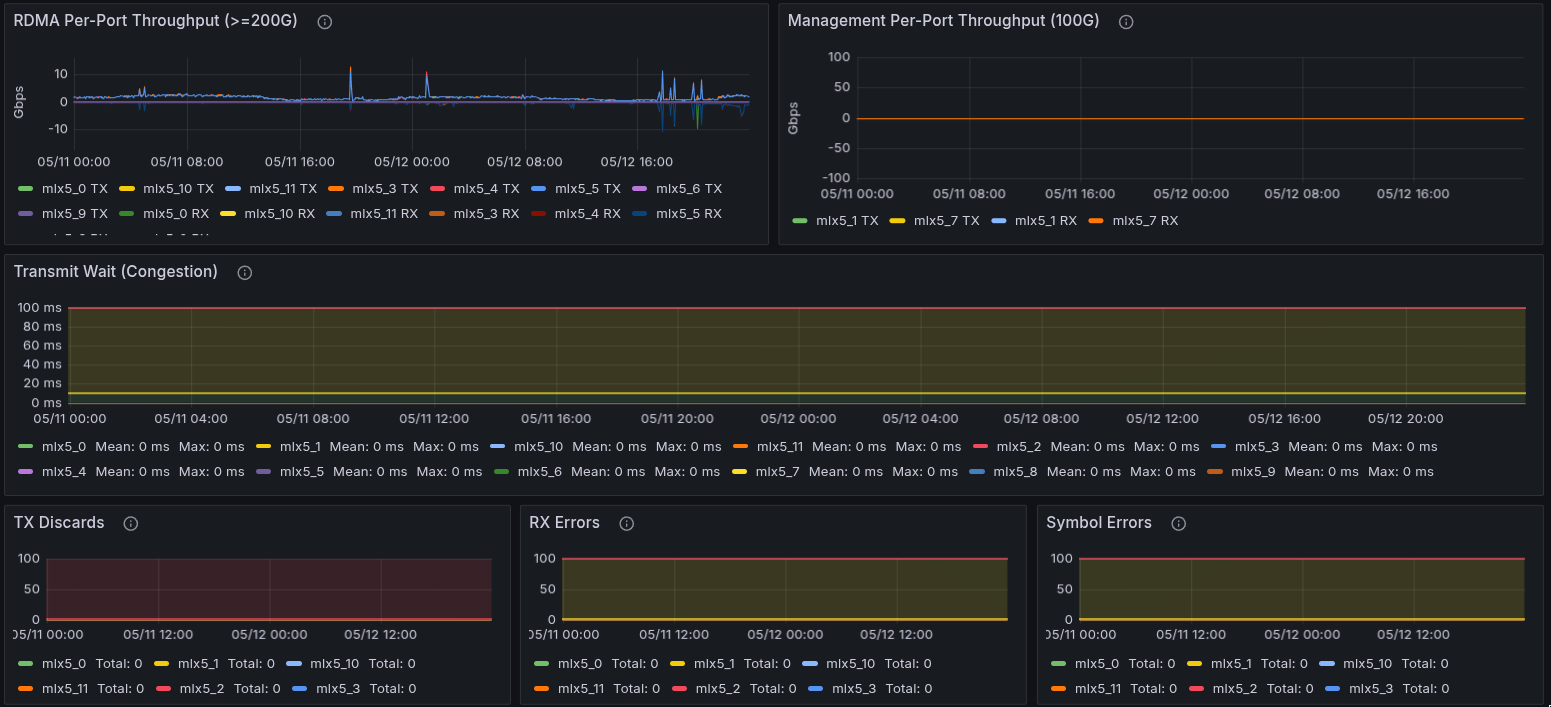
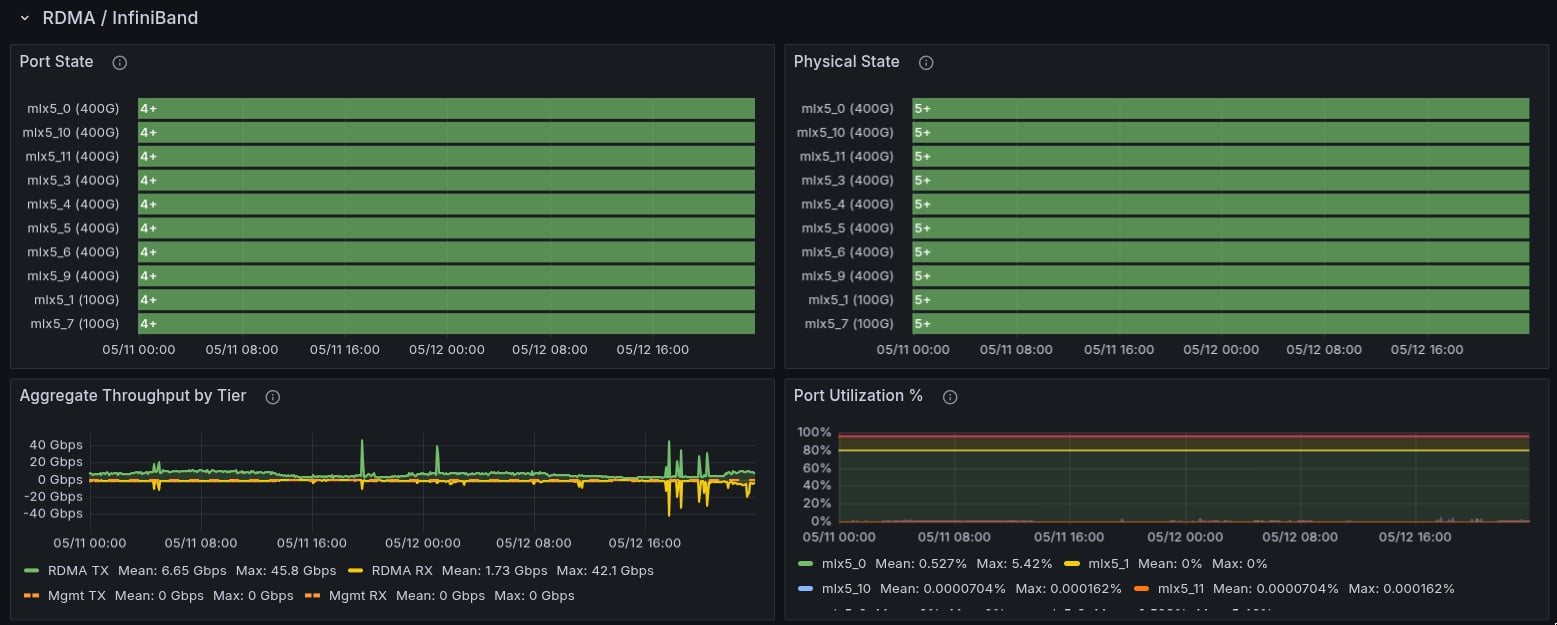
InfiniBand bandwidth
Review throughput, transmit wait, link rate, and fabric congestion discards.
Slurm node mapping
Map Slurm node names to Kubernetes hostnames.
Escalation
Collect support context and identify immediate escalation triggers.
Check low GPU utilization
Determine whether GPUs are idle or bottlenecked elsewhere.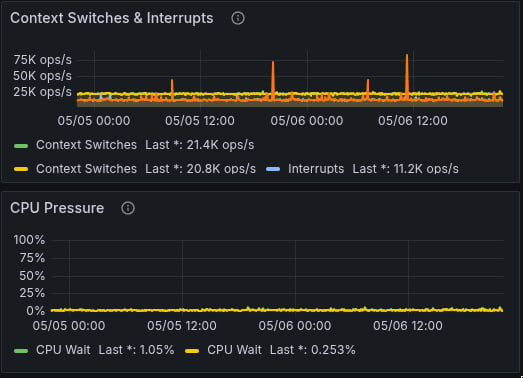
Check GPU throttling
Check ECC errors
GPUUncorrectableEccErrors. If DBE errors are present and the node is still scheduling jobs, escalate immediately.
XID errors
XID errors are GPU fault codes from the NVIDIA driver. Common critical XIDs:| XID | Meaning | Impact |
|---|---|---|
| 31 | GPU memory page fault | Job crash |
| 43 | GPU stopped processing | Job hang or crash |
| 45 | Preemptive cleanup (double-bit ECC) | GPU pulled from service |
| 48 | Double-bit ECC error | GPU needs replacement |
| 63 | ECC page retirement / row remap | Degraded but functional |
| 64 | ECC page retirement (DBE) | GPU needs replacement |
| 74 | NVLink error | Multi-GPU communication failure |
| 79 | GPU fallen off bus | Node needs reboot |
| 94 | Contained ECC error | Usually recoverable |
| 95 | Uncontained ECC error | GPU needs replacement |
NVLink and PCIe issues
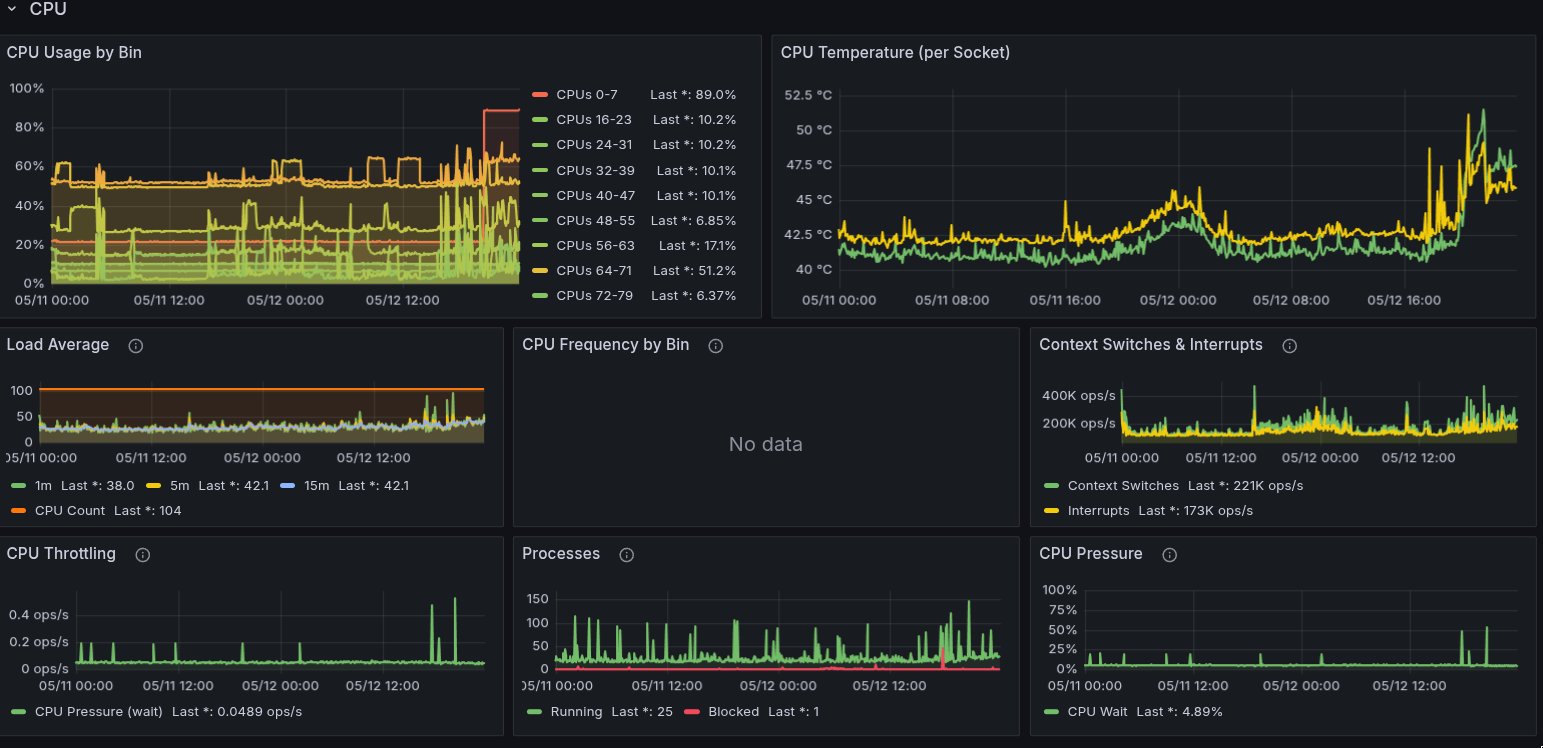
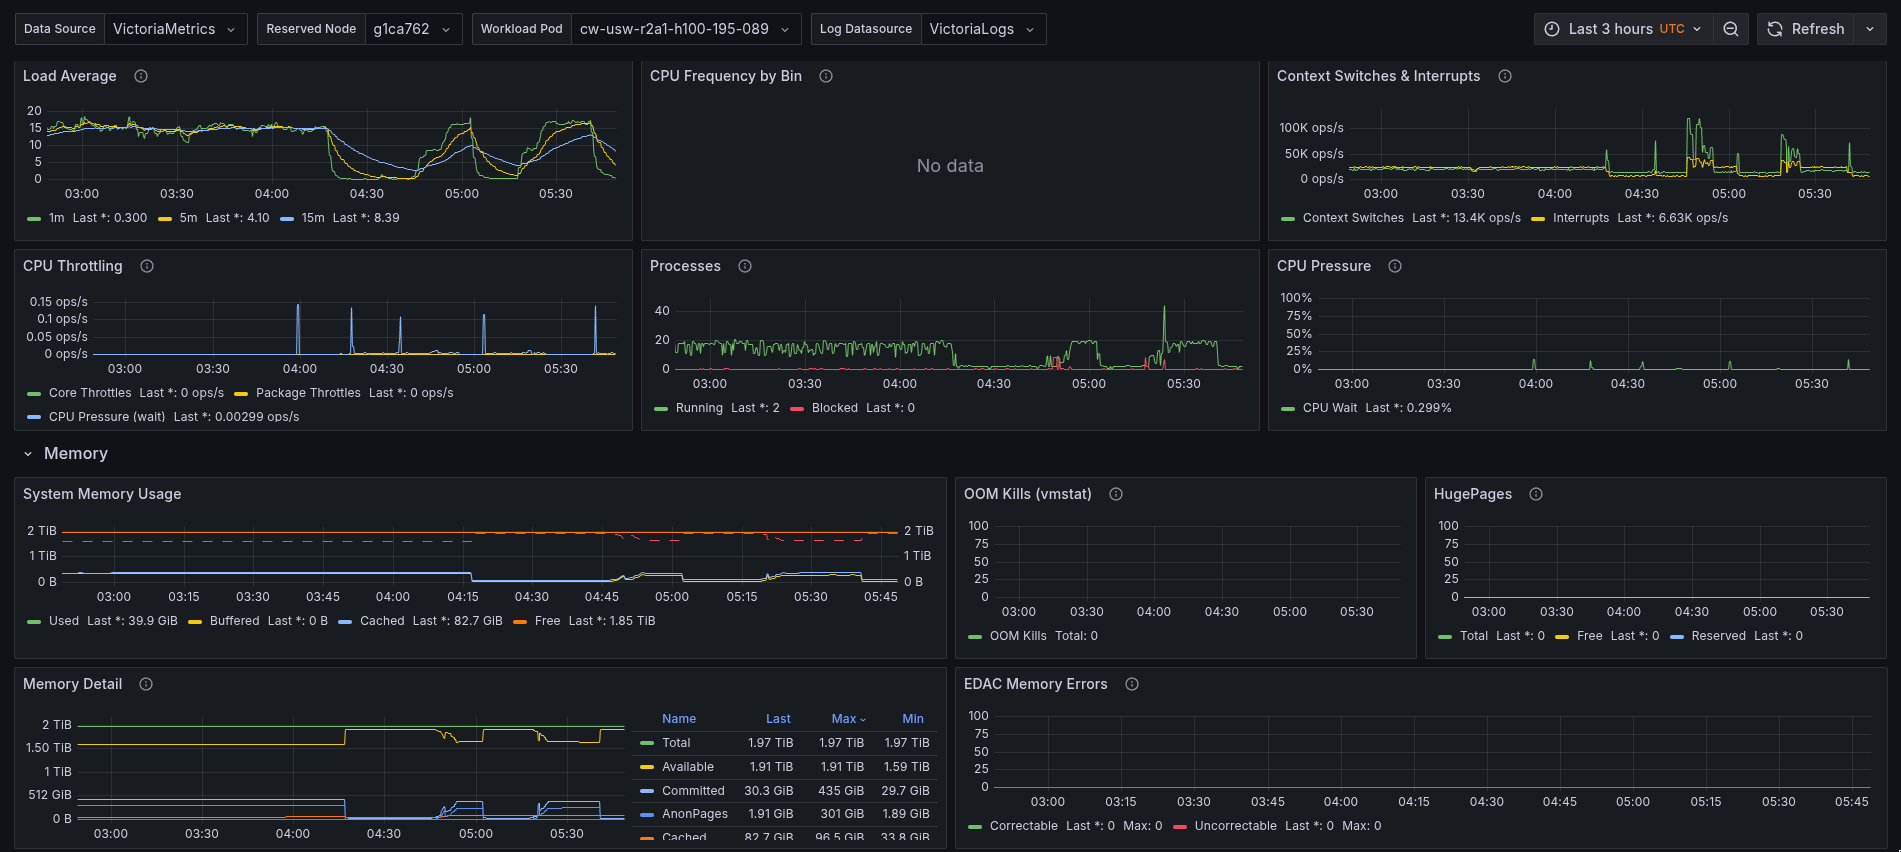
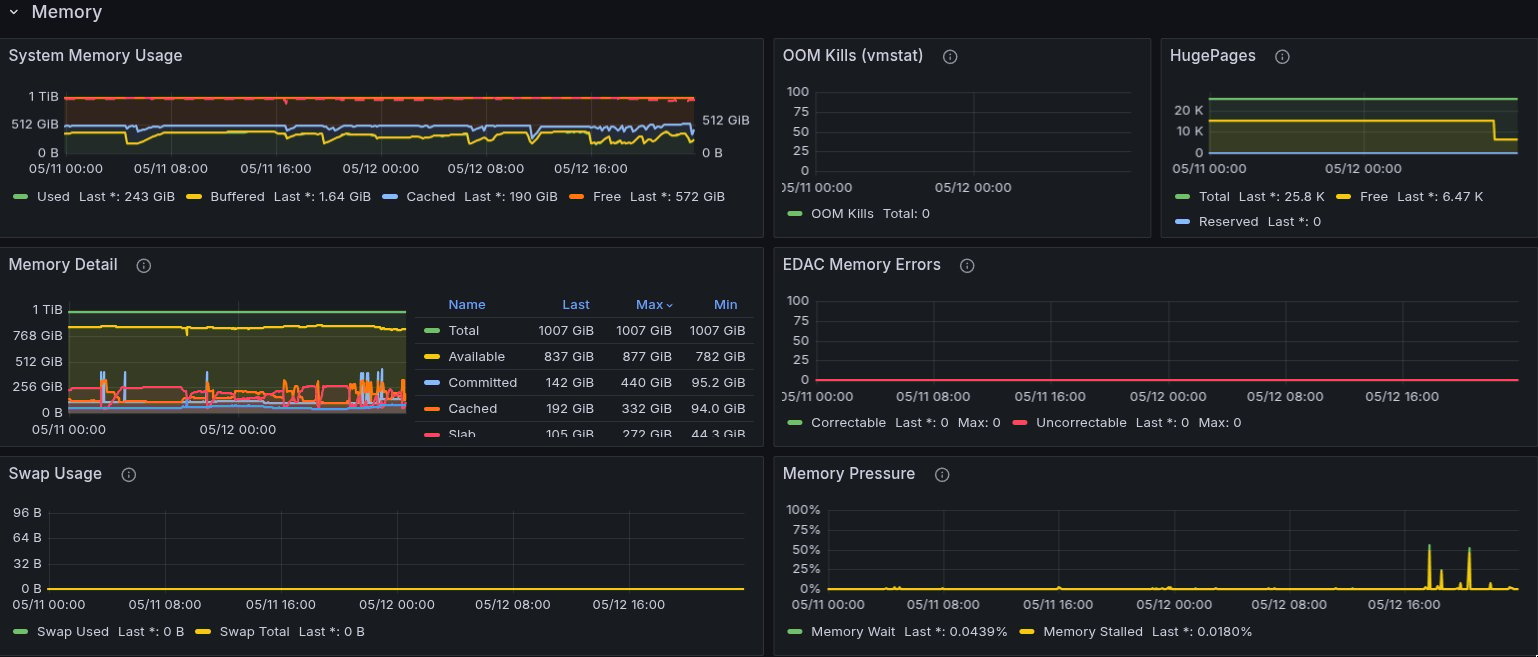
Node CPU and memory
Check InfiniBand bandwidth
Slurm to Kubernetes node mapping
Slurm uses names likeh200-reserved-145-019. Kubernetes uses names like andromeda25-wk45. To map between them:
kube_pod_info provides the node label (Kubernetes hostname).
Tenant capacity
Container resource usage
Prepare a support request
Include the following in any support request:- Cluster name and time range (absolute, not relative)
- Affected nodes (Slurm names and/or Kubernetes hostnames)
- Job IDs if Slurm jobs are involved
- Dashboard link with the time range pinned
- Observed behavior vs expected behavior