Node naming
| Context | Name format | Example |
|---|---|---|
| Slurm | <gpu>-reserved-<subnet>-<id> | h200-reserved-145-019 |
| Kubernetes | Cluster-specific hostname | andromeda25-wk45 |
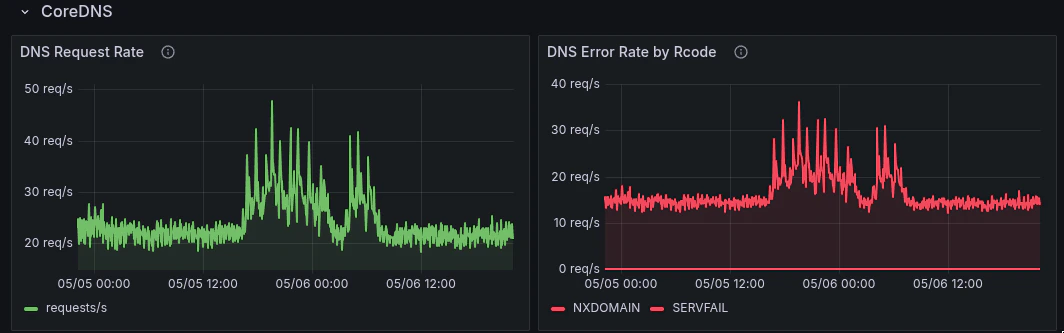
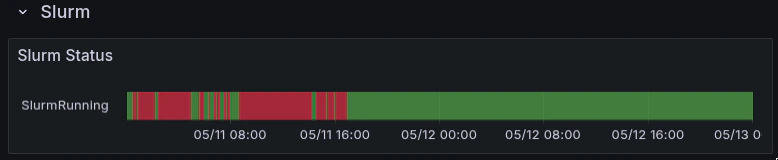
Key Slurm metrics
Job state
RUNNING, PENDING, COMPLETING, FAILED, CANCELLED, TIMEOUT, NODE_FAIL.
slurm_job_state does not carry a node label. It identifies a job and its state, but not which nodes it runs on.
Job-to-node mapping
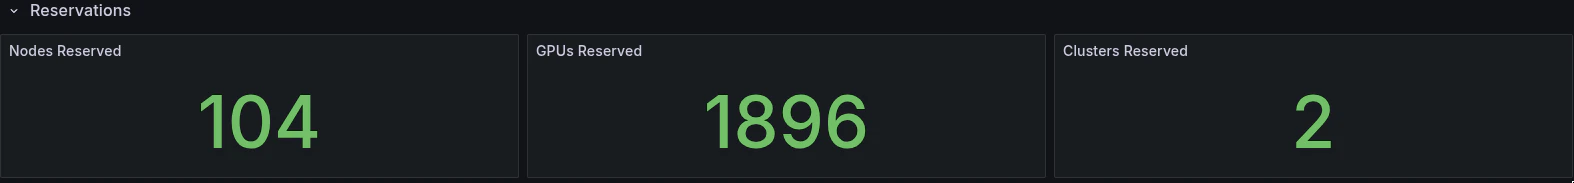
Tenant capacity
Common scenarios
Job stuck in PENDING
Check available capacity:ready equals assigned, all nodes are available and the issue is likely scheduling constraints: partition, features, or resource request. From your Slurm login shell:
ready < assigned, some nodes are drained or unhealthy. Check GPU Nodes dashboard to identify which nodes are affected.
Job running but slow
- Check GPU utilization on the job’s nodes:
- Compare GPUs within the same node. One GPU significantly lower than siblings suggests a hardware issue: ECC errors, thermal throttle, or NVLink degradation.
- Check for asymmetric performance across nodes in a multi-node job:
Node drained unexpectedly
Nodes are automatically drained when:- Uncorrectable ECC errors are detected (
GPUUncorrectableEccErrors) - A critical XID error appears in host diagnostics (
GpuCriticalXid) - A machine check exception occurs (
MachineCheckException) - A GPU falls off the bus (XID 79)
Commands from your Slurm login
Run these from the environment where you submit jobs: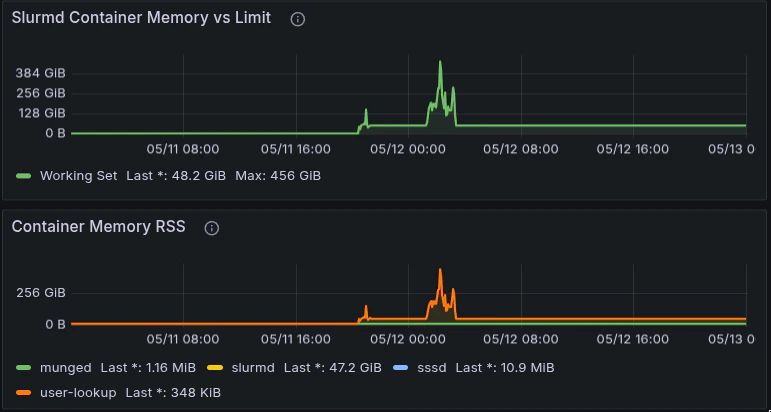
scontrol show job -dd to see exact GPU index allocation (for example, GRES=gpu:h100:1(IDX:4)). Pair that output with GPU utilization panels in Grafana while you debug a job.