> ## Documentation Index
> Fetch the complete documentation index at: https://docs.andromeda.ai/llms.txt
> Use this file to discover all available pages before exploring further.
# Troubleshooting
> Diagnostic queries for common problems.
Use this page to map common GPU, node, Slurm, InfiniBand, and container symptoms to scoped dashboard checks and queries. Replace `$cluster` and `$node` with actual values or use dashboard template variables.
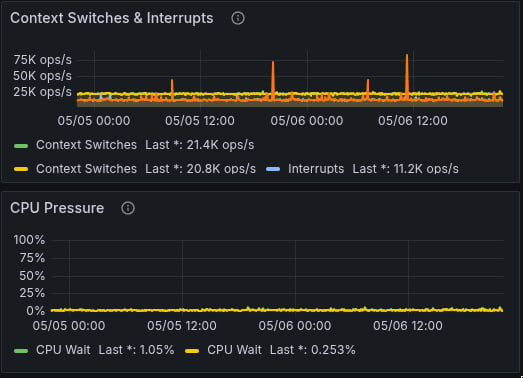
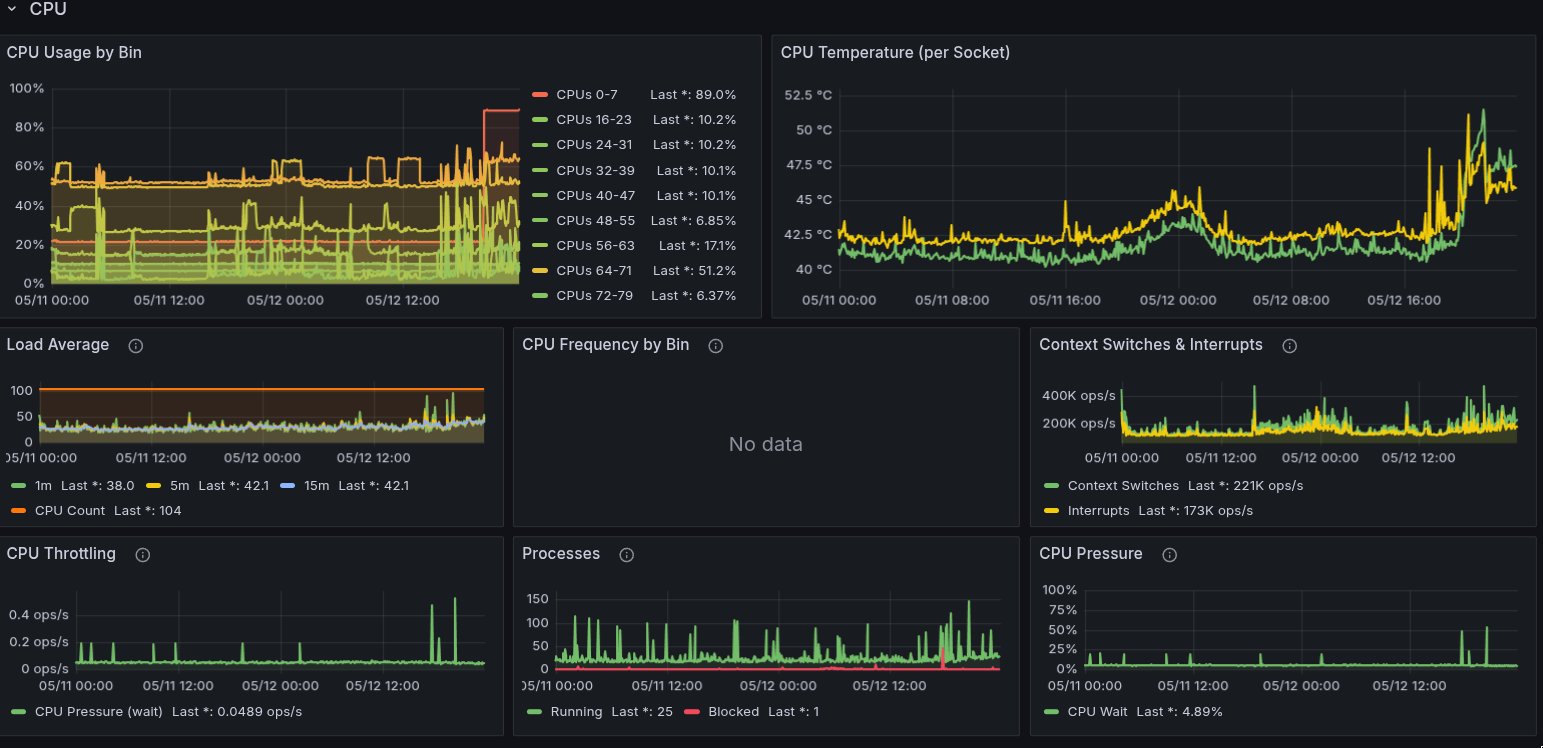
Compare GPU utilization, power, CPU pressure, I/O pressure, and memory pressure.
Check GPU temperature, HBM temperature, and thermal violation counters.
Identify uncorrectable errors, row remap failures, and critical XID codes.
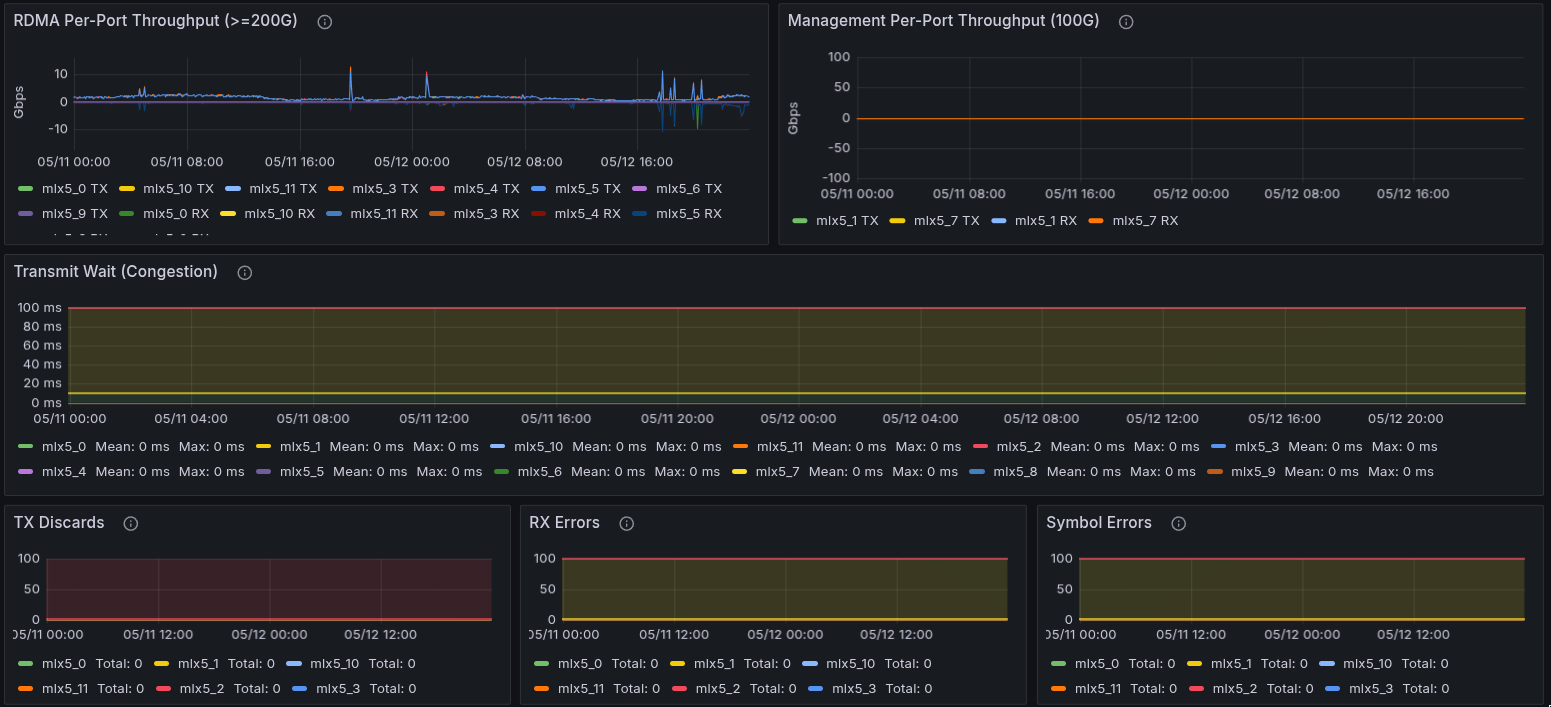
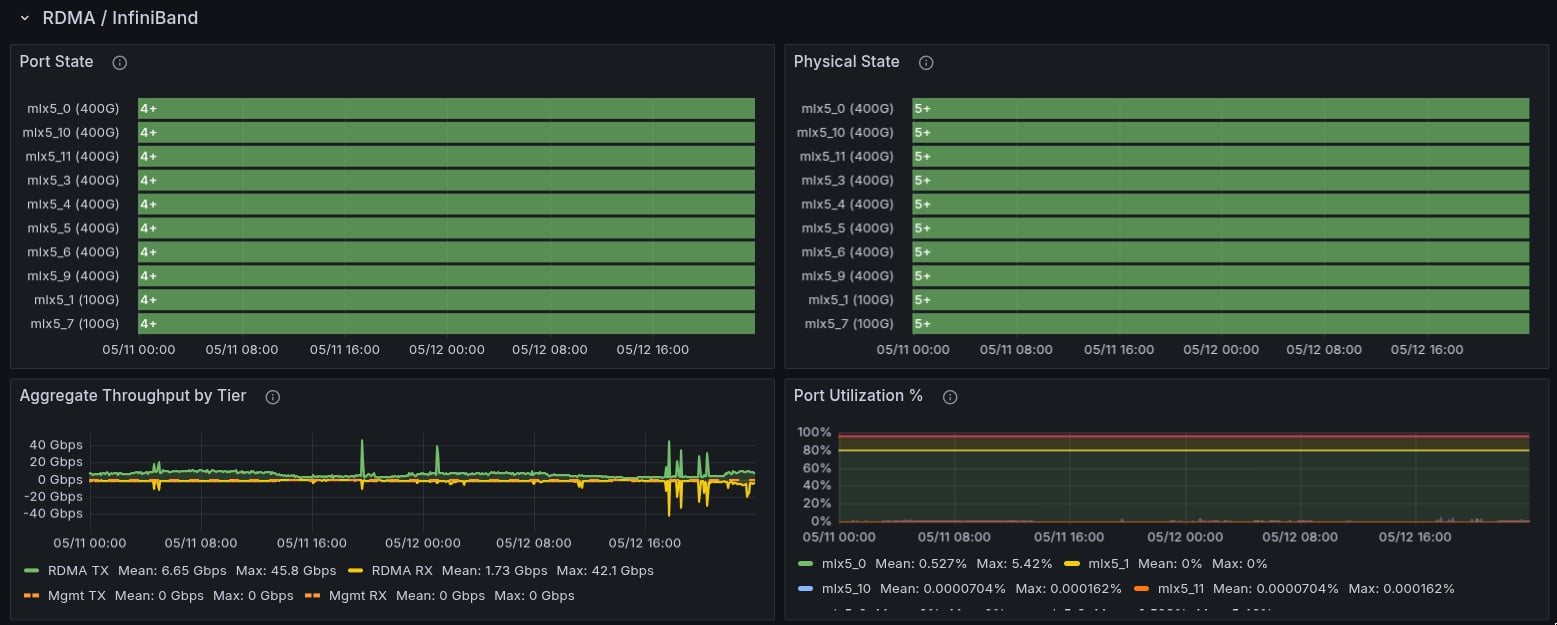
Review throughput, transmit wait, link rate, and fabric congestion discards.
Map Slurm node names to Kubernetes hostnames.
Collect support context and identify immediate escalation triggers.
## Check low GPU utilization
Determine whether GPUs are idle or bottlenecked elsewhere.
 ```txt theme={null}
DCGM_FI_DEV_GPU_UTIL{cluster="$cluster"}
```
```txt theme={null}
DCGM_FI_DEV_POWER_USAGE{cluster="$cluster", node="$node"}
```
Idle GPUs draw \~70-100W; active H100s draw 500-700W.
```txt theme={null}
rate(tenant_node_pressure_cpu_waiting_seconds_total{cluster="$cluster", node="$node"}[5m])
```
```txt theme={null}
rate(tenant_node_pressure_io_stalled_seconds_total{cluster="$cluster", node="$node"}[5m])
```
```txt theme={null}
rate(tenant_node_pressure_memory_stalled_seconds_total{cluster="$cluster", node="$node"}[5m])
```
If GPU utilization is low but power draw is near TDP and PSI metrics are clean, the bottleneck is likely application-side: synchronization, gradient accumulation, or communication overlap.
## Check GPU throttling
```txt theme={null}
DCGM_FI_DEV_GPU_TEMP{cluster="$cluster", node="$node"}
```
Throttle threshold: 83 °C.
```txt theme={null}
DCGM_FI_DEV_MEMORY_TEMP{cluster="$cluster", node="$node"}
```
HBM throttle threshold: 95 °C.
```txt theme={null}
rate(DCGM_FI_DEV_THERMAL_VIOLATION{cluster="$cluster", node="$node"}[5m])
```
Sustained thermal throttling reduces clock speeds and power budget. Report the node if this persists; it may indicate a cooling failure.
## Check ECC errors
```txt theme={null}
DCGM_FI_DEV_ECC_DBE_AGG_TOTAL{cluster="$cluster"} > 0
```
Any nonzero uncorrectable (DBE) value indicates a faulty GPU.
```txt theme={null}
increase(DCGM_FI_DEV_ECC_SBE_AGG_TOTAL{cluster="$cluster"}[1h])
```
Correctable error rate >10/hr is concerning.
```txt theme={null}
DCGM_FI_DEV_ROW_REMAP_FAILURE{cluster="$cluster"} > 0
```
Row remap failure means the GPU needs replacement.
Uncorrectable errors trigger `GPUUncorrectableEccErrors`. If DBE errors are present and the node is still scheduling jobs, escalate immediately.
## XID errors
XID errors are GPU fault codes from the NVIDIA driver. Common critical XIDs:
| XID | Meaning | Impact |
| --- | ----------------------------------- | ------------------------------- |
| 31 | GPU memory page fault | Job crash |
| 43 | GPU stopped processing | Job hang or crash |
| 45 | Preemptive cleanup (double-bit ECC) | GPU pulled from service |
| 48 | Double-bit ECC error | GPU needs replacement |
| 63 | ECC page retirement / row remap | Degraded but functional |
| 64 | ECC page retirement (DBE) | GPU needs replacement |
| 74 | NVLink error | Multi-GPU communication failure |
| 79 | GPU fallen off bus | Node needs reboot |
| 94 | Contained ECC error | Usually recoverable |
| 95 | Uncontained ECC error | GPU needs replacement |
```txt theme={null}
DCGM_FI_DEV_XID_ERRORS{cluster="$cluster"} > 0
```
## NVLink and PCIe issues
```txt theme={null}
increase(DCGM_FI_DEV_GPU_NVLINK_ERRORS{cluster="$cluster"}[15m]) > 0
```
```txt theme={null}
increase(DCGM_FI_DEV_PCIE_REPLAY_COUNTER{cluster="$cluster"}[15m])
```
NVLink errors degrade multi-GPU training such as AllReduce and tensor parallelism. PCIe replay errors indicate link instability between GPU and CPU or switch. More than 50 replays in 15 minutes is concerning.
## Node CPU and memory
```txt theme={null}
DCGM_FI_DEV_GPU_UTIL{cluster="$cluster"}
```
```txt theme={null}
DCGM_FI_DEV_POWER_USAGE{cluster="$cluster", node="$node"}
```
Idle GPUs draw \~70-100W; active H100s draw 500-700W.
```txt theme={null}
rate(tenant_node_pressure_cpu_waiting_seconds_total{cluster="$cluster", node="$node"}[5m])
```
```txt theme={null}
rate(tenant_node_pressure_io_stalled_seconds_total{cluster="$cluster", node="$node"}[5m])
```
```txt theme={null}
rate(tenant_node_pressure_memory_stalled_seconds_total{cluster="$cluster", node="$node"}[5m])
```
If GPU utilization is low but power draw is near TDP and PSI metrics are clean, the bottleneck is likely application-side: synchronization, gradient accumulation, or communication overlap.
## Check GPU throttling
```txt theme={null}
DCGM_FI_DEV_GPU_TEMP{cluster="$cluster", node="$node"}
```
Throttle threshold: 83 °C.
```txt theme={null}
DCGM_FI_DEV_MEMORY_TEMP{cluster="$cluster", node="$node"}
```
HBM throttle threshold: 95 °C.
```txt theme={null}
rate(DCGM_FI_DEV_THERMAL_VIOLATION{cluster="$cluster", node="$node"}[5m])
```
Sustained thermal throttling reduces clock speeds and power budget. Report the node if this persists; it may indicate a cooling failure.
## Check ECC errors
```txt theme={null}
DCGM_FI_DEV_ECC_DBE_AGG_TOTAL{cluster="$cluster"} > 0
```
Any nonzero uncorrectable (DBE) value indicates a faulty GPU.
```txt theme={null}
increase(DCGM_FI_DEV_ECC_SBE_AGG_TOTAL{cluster="$cluster"}[1h])
```
Correctable error rate >10/hr is concerning.
```txt theme={null}
DCGM_FI_DEV_ROW_REMAP_FAILURE{cluster="$cluster"} > 0
```
Row remap failure means the GPU needs replacement.
Uncorrectable errors trigger `GPUUncorrectableEccErrors`. If DBE errors are present and the node is still scheduling jobs, escalate immediately.
## XID errors
XID errors are GPU fault codes from the NVIDIA driver. Common critical XIDs:
| XID | Meaning | Impact |
| --- | ----------------------------------- | ------------------------------- |
| 31 | GPU memory page fault | Job crash |
| 43 | GPU stopped processing | Job hang or crash |
| 45 | Preemptive cleanup (double-bit ECC) | GPU pulled from service |
| 48 | Double-bit ECC error | GPU needs replacement |
| 63 | ECC page retirement / row remap | Degraded but functional |
| 64 | ECC page retirement (DBE) | GPU needs replacement |
| 74 | NVLink error | Multi-GPU communication failure |
| 79 | GPU fallen off bus | Node needs reboot |
| 94 | Contained ECC error | Usually recoverable |
| 95 | Uncontained ECC error | GPU needs replacement |
```txt theme={null}
DCGM_FI_DEV_XID_ERRORS{cluster="$cluster"} > 0
```
## NVLink and PCIe issues
```txt theme={null}
increase(DCGM_FI_DEV_GPU_NVLINK_ERRORS{cluster="$cluster"}[15m]) > 0
```
```txt theme={null}
increase(DCGM_FI_DEV_PCIE_REPLAY_COUNTER{cluster="$cluster"}[15m])
```
NVLink errors degrade multi-GPU training such as AllReduce and tensor parallelism. PCIe replay errors indicate link instability between GPU and CPU or switch. More than 50 replays in 15 minutes is concerning.
## Node CPU and memory
 ```txt theme={null}
1 - avg by (node) (
rate(tenant_node_cpu_seconds_total:15s_without_cpu_total{cluster="$cluster", mode="idle"}[5m])
)
```
```txt theme={null}
1 - avg by (node, numa) (
irate(tenant_node_cpu_seconds_total:15s_without_cpu_total{cluster="$cluster", mode="idle"}[2m])
)
```
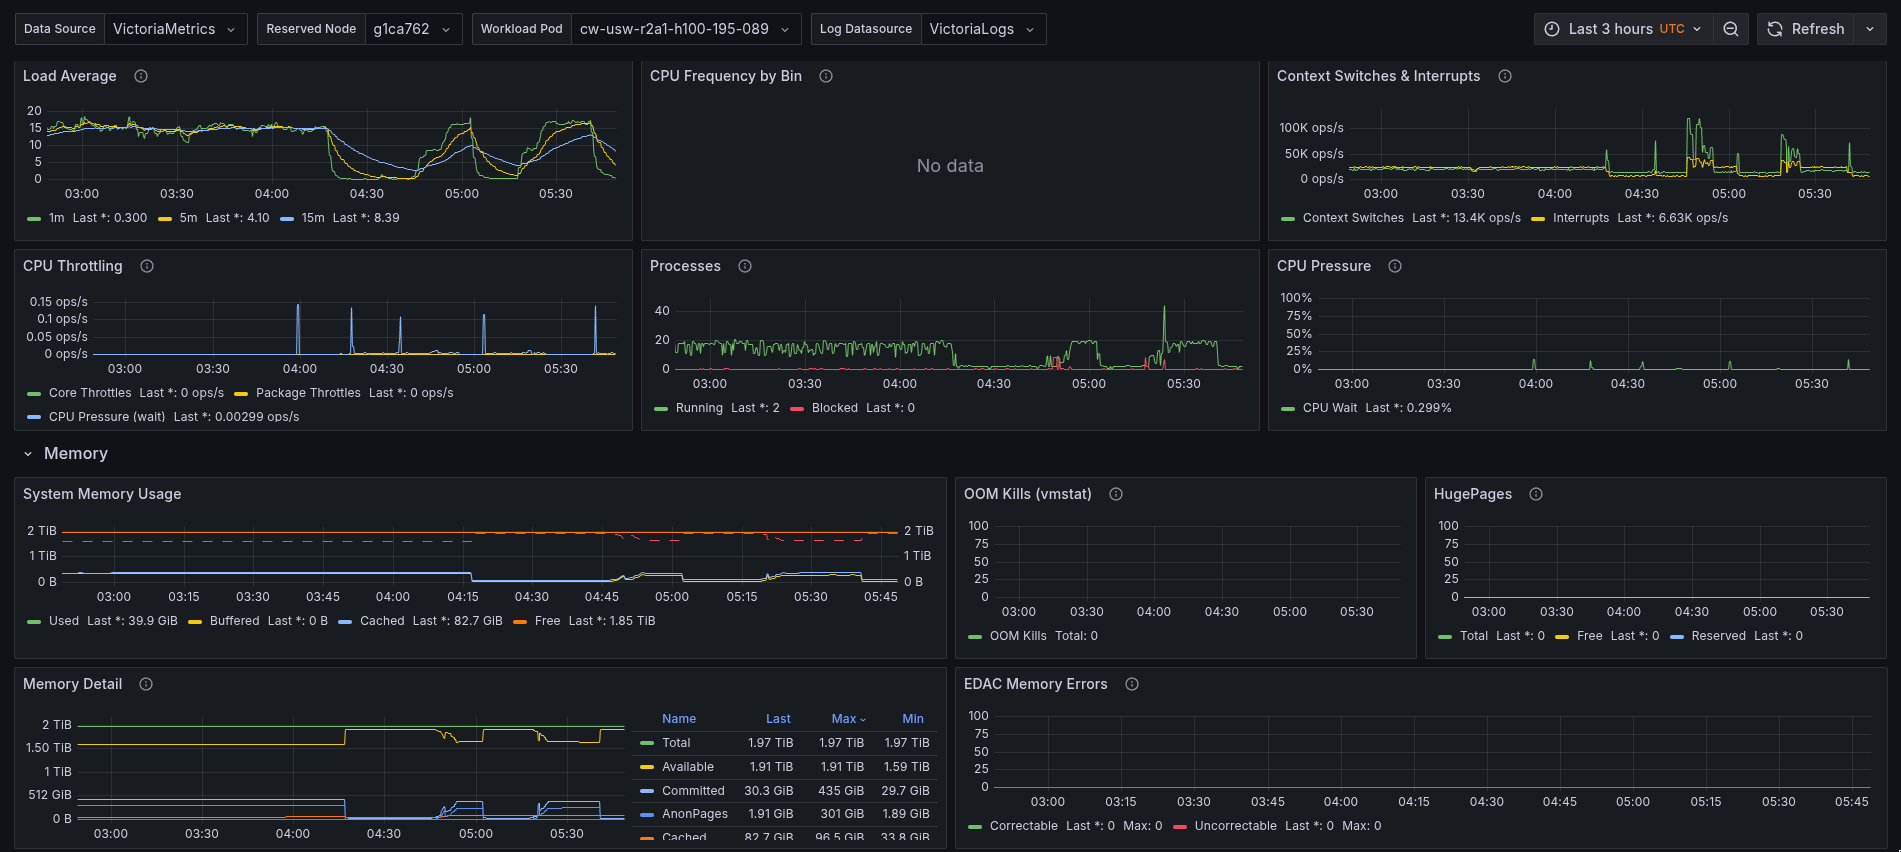
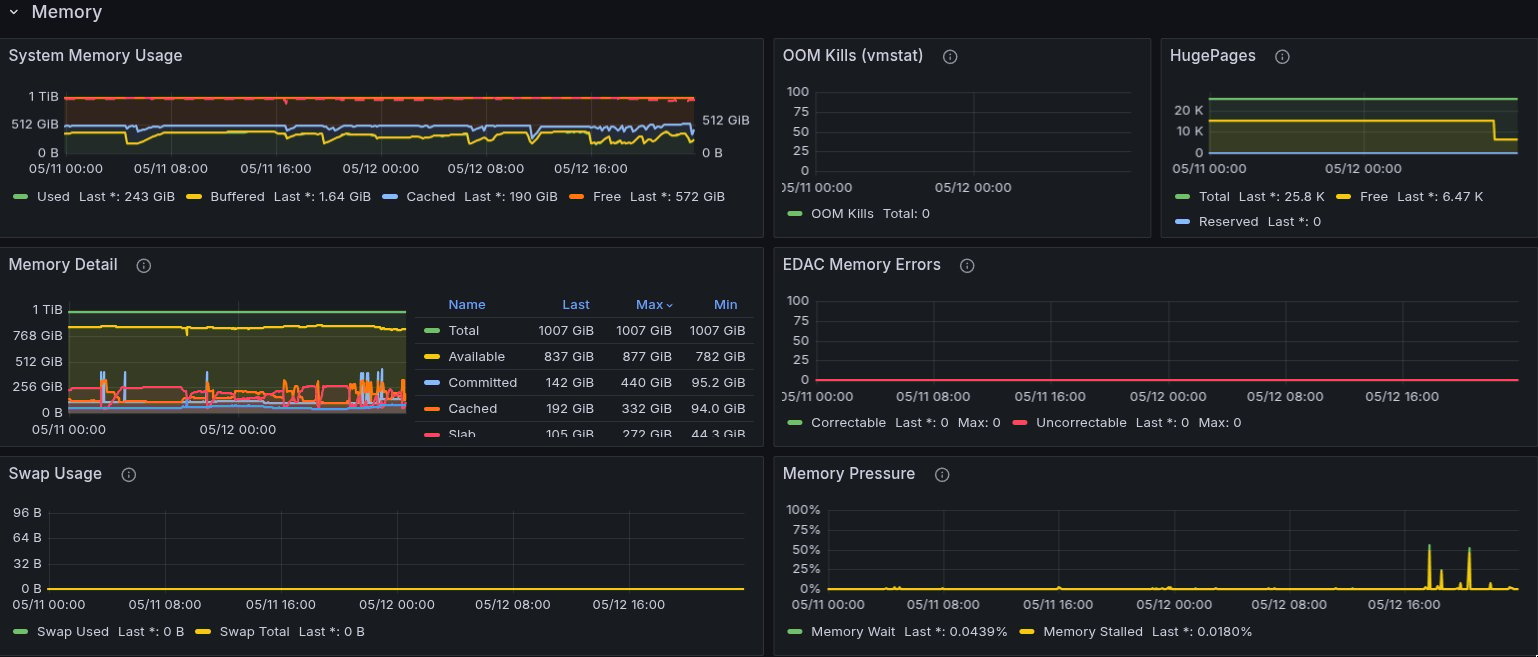
Per-NUMA breakdown helps identify asymmetric CPU load.
```txt theme={null}
tenant_node_memory_MemAvailable_bytes{cluster="$cluster", node="$node"}
```
```txt theme={null}
increase(tenant_node_vmstat_oom_kill{cluster="$cluster", node="$node"}[1h])
```
Any OOM kill increase warrants investigation.
## Check InfiniBand bandwidth
```txt theme={null}
1 - avg by (node) (
rate(tenant_node_cpu_seconds_total:15s_without_cpu_total{cluster="$cluster", mode="idle"}[5m])
)
```
```txt theme={null}
1 - avg by (node, numa) (
irate(tenant_node_cpu_seconds_total:15s_without_cpu_total{cluster="$cluster", mode="idle"}[2m])
)
```
Per-NUMA breakdown helps identify asymmetric CPU load.
```txt theme={null}
tenant_node_memory_MemAvailable_bytes{cluster="$cluster", node="$node"}
```
```txt theme={null}
increase(tenant_node_vmstat_oom_kill{cluster="$cluster", node="$node"}[1h])
```
Any OOM kill increase warrants investigation.
## Check InfiniBand bandwidth

 ```txt theme={null}
irate(tenant_node_infiniband_port_data_transmitted_bytes_total{cluster="$cluster", node="$node"}[1m]) * 8 / 1e9
```
TX bandwidth in Gbps.
```txt theme={null}
irate(tenant_node_infiniband_port_transmit_wait_total{cluster="$cluster", node="$node"}[1m]) * 4 / 1000000
```
Transmit wait in ms/s. Any value >0 indicates congestion.
```txt theme={null}
tenant_node_infiniband_rate_bytes_per_second{cluster="$cluster", node="$node"}
```
50GB/s = NDR/400G link.
```txt theme={null}
rate(tenant_ib_perfquery_xmit_discards_total{cluster="$cluster"}[5m])
```
Fabric-level congestion discards.
## Slurm to Kubernetes node mapping
Slurm uses names like `h200-reserved-145-019`. Kubernetes uses names like `andromeda25-wk45`. To map between them:
```txt theme={null}
kube_pod_info{pod=~"h200-reserved-.*", cluster="$cluster"}
```
The Slurm node name matches the Kubernetes pod name for that compute instance. `kube_pod_info` provides the `node` label (Kubernetes hostname).
## Tenant capacity
```txt theme={null}
tenant:slurm_nodes:assigned{cluster="$cluster"}
tenant:slurm_nodes:ready{cluster="$cluster"}
tenant:slurm_nodes:bad{cluster="$cluster"}
```
```txt theme={null}
tenant:slurm_nodes:ready{cluster="$cluster"} / tenant:slurm_nodes:assigned{cluster="$cluster"}
```
Readiness ratio should be 1.0.
## Container resource usage
```txt theme={null}
irate(tenant_node_infiniband_port_data_transmitted_bytes_total{cluster="$cluster", node="$node"}[1m]) * 8 / 1e9
```
TX bandwidth in Gbps.
```txt theme={null}
irate(tenant_node_infiniband_port_transmit_wait_total{cluster="$cluster", node="$node"}[1m]) * 4 / 1000000
```
Transmit wait in ms/s. Any value >0 indicates congestion.
```txt theme={null}
tenant_node_infiniband_rate_bytes_per_second{cluster="$cluster", node="$node"}
```
50GB/s = NDR/400G link.
```txt theme={null}
rate(tenant_ib_perfquery_xmit_discards_total{cluster="$cluster"}[5m])
```
Fabric-level congestion discards.
## Slurm to Kubernetes node mapping
Slurm uses names like `h200-reserved-145-019`. Kubernetes uses names like `andromeda25-wk45`. To map between them:
```txt theme={null}
kube_pod_info{pod=~"h200-reserved-.*", cluster="$cluster"}
```
The Slurm node name matches the Kubernetes pod name for that compute instance. `kube_pod_info` provides the `node` label (Kubernetes hostname).
## Tenant capacity
```txt theme={null}
tenant:slurm_nodes:assigned{cluster="$cluster"}
tenant:slurm_nodes:ready{cluster="$cluster"}
tenant:slurm_nodes:bad{cluster="$cluster"}
```
```txt theme={null}
tenant:slurm_nodes:ready{cluster="$cluster"} / tenant:slurm_nodes:assigned{cluster="$cluster"}
```
Readiness ratio should be 1.0.
## Container resource usage
 ```txt theme={null}
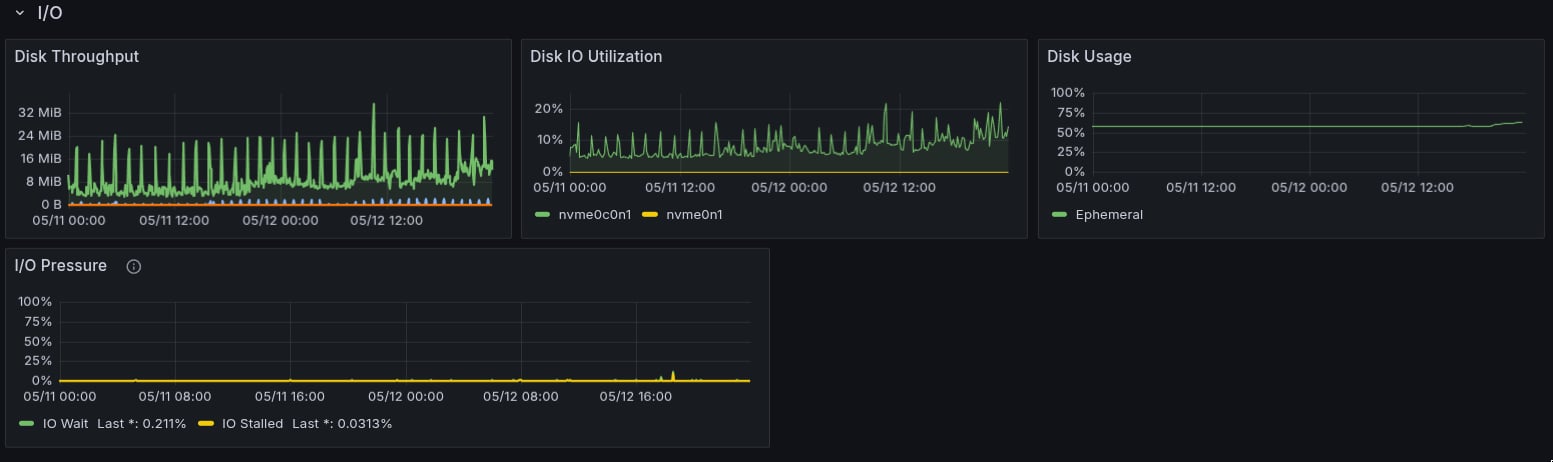
rate(container_cpu_usage_seconds_total{namespace="$namespace", pod="$pod"}[5m])
```
```txt theme={null}
container_memory_working_set_bytes{namespace="$namespace", pod="$pod"}
```
Working set is the metric that determines OOM kills.
## Prepare a support request
Include the following in any support request:
1. **Cluster name** and **time range** (absolute, not relative)
2. **Affected nodes** (Slurm names and/or Kubernetes hostnames)
3. **Job IDs** if Slurm jobs are involved
4. **Dashboard link** with the time range pinned
5. **Observed behavior** vs **expected behavior**
Escalate immediately if any of the following are true:
* Uncorrectable ECC errors on a node that is still scheduling
* `tenant:slurm_nodes:ready` at 0 with nonzero `assigned`
* XID 79 (GPU fallen off bus) on any node
* An alert chain where the expected consequence did not fire. See [Alerts](/monitoring-alerting/alerts#expected-alert-chains).
```txt theme={null}
rate(container_cpu_usage_seconds_total{namespace="$namespace", pod="$pod"}[5m])
```
```txt theme={null}
container_memory_working_set_bytes{namespace="$namespace", pod="$pod"}
```
Working set is the metric that determines OOM kills.
## Prepare a support request
Include the following in any support request:
1. **Cluster name** and **time range** (absolute, not relative)
2. **Affected nodes** (Slurm names and/or Kubernetes hostnames)
3. **Job IDs** if Slurm jobs are involved
4. **Dashboard link** with the time range pinned
5. **Observed behavior** vs **expected behavior**
Escalate immediately if any of the following are true:
* Uncorrectable ECC errors on a node that is still scheduling
* `tenant:slurm_nodes:ready` at 0 with nonzero `assigned`
* XID 79 (GPU fallen off bus) on any node
* An alert chain where the expected consequence did not fire. See [Alerts](/monitoring-alerting/alerts#expected-alert-chains).