> ## Documentation Index
> Fetch the complete documentation index at: https://docs.andromeda.ai/llms.txt
> Use this file to discover all available pages before exploring further.
# Slurm Monitoring
> Monitoring Slurm jobs, nodes, and scheduling alongside Grafana dashboards.
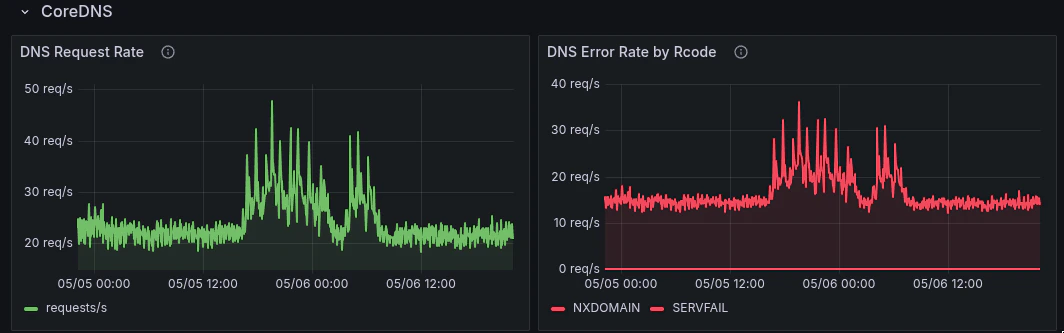
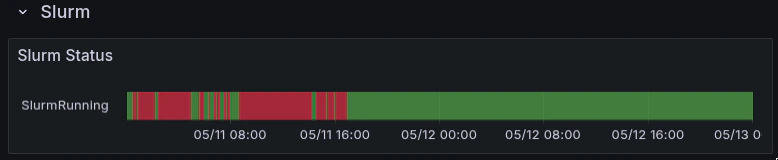
Slurm runs on the same infrastructure shown in your Grafana dashboards. Slurm node names and Kubernetes hostnames differ, which affects how you read metrics and panels.
Use this page when a Slurm job is pending, slow, drained unexpectedly, or needs mapping between Slurm node names and Kubernetes hostnames.
 ## Node naming
| Context | Name format | Example |
| ---------- | ------------------------------ | ----------------------- |
| Slurm | `-reserved--` | `h200-reserved-145-019` |
| Kubernetes | Cluster-specific hostname | `andromeda25-wk45` |
The Slurm node name matches the Kubernetes pod name for that compute instance. Dashboards join on `kube_pod_info` to bridge these. For the raw query, see [Troubleshooting](/monitoring-alerting/troubleshooting#slurm-to-kubernetes-node-mapping).
## Key Slurm metrics
### Job state
```txt theme={null}
slurm_job_state{cluster="$cluster"}
```
States: `RUNNING`, `PENDING`, `COMPLETING`, `FAILED`, `CANCELLED`, `TIMEOUT`, `NODE_FAIL`.
`slurm_job_state` does **not** carry a `node` label. It identifies a job and its state, but not which nodes it runs on.
### Job-to-node mapping
```txt theme={null}
slurm_job_gpus_allocated{cluster="$cluster", job_id="$job_id"}
```
```txt theme={null}
slurm_job_cpus_allocated{cluster="$cluster", job_id="$job_id"}
```
These carry per-node labels showing GPU/CPU allocation per Slurm node.
### Tenant capacity
## Node naming
| Context | Name format | Example |
| ---------- | ------------------------------ | ----------------------- |
| Slurm | `-reserved--` | `h200-reserved-145-019` |
| Kubernetes | Cluster-specific hostname | `andromeda25-wk45` |
The Slurm node name matches the Kubernetes pod name for that compute instance. Dashboards join on `kube_pod_info` to bridge these. For the raw query, see [Troubleshooting](/monitoring-alerting/troubleshooting#slurm-to-kubernetes-node-mapping).
## Key Slurm metrics
### Job state
```txt theme={null}
slurm_job_state{cluster="$cluster"}
```
States: `RUNNING`, `PENDING`, `COMPLETING`, `FAILED`, `CANCELLED`, `TIMEOUT`, `NODE_FAIL`.
`slurm_job_state` does **not** carry a `node` label. It identifies a job and its state, but not which nodes it runs on.
### Job-to-node mapping
```txt theme={null}
slurm_job_gpus_allocated{cluster="$cluster", job_id="$job_id"}
```
```txt theme={null}
slurm_job_cpus_allocated{cluster="$cluster", job_id="$job_id"}
```
These carry per-node labels showing GPU/CPU allocation per Slurm node.
### Tenant capacity
 ```txt theme={null}
tenant:slurm_nodes:assigned{cluster="$cluster"}
tenant:slurm_nodes:ready{cluster="$cluster"}
tenant:slurm_nodes:bad{cluster="$cluster"}
```
## Common scenarios
### Job stuck in PENDING
Check available capacity:
```txt theme={null}
tenant:slurm_nodes:ready{cluster="$cluster"}
```
If `ready` equals `assigned`, all nodes are available and the issue is likely scheduling constraints: partition, features, or resource request. From your Slurm login shell:
```bash theme={null}
squeue --me --long
scontrol show job $JOBID
```
If `ready` \< `assigned`, some nodes are drained or unhealthy. Check GPU Nodes dashboard to identify which nodes are affected.
### Job running but slow
1. Check GPU utilization on the job's nodes:
```txt theme={null}
DCGM_FI_DEV_GPU_UTIL{cluster="$cluster", node=~"$slurm_nodes"}
```
2. Compare GPUs within the same node. One GPU significantly lower than siblings suggests a hardware issue: ECC errors, thermal throttle, or NVLink degradation.
3. Check for asymmetric performance across nodes in a multi-node job:
```txt theme={null}
avg by (node) (DCGM_FI_DEV_GPU_UTIL{cluster="$cluster", node=~"$slurm_nodes"})
```
A straggler node drags down the entire distributed job. If one node is consistently 20%+ lower than peers, check its ECC status and thermals.
### Node drained unexpectedly
Nodes are automatically drained when:
* Uncorrectable ECC errors are detected (`GPUUncorrectableEccErrors`)
* A critical XID error appears in host diagnostics (`GpuCriticalXid`)
* A machine check exception occurs (`MachineCheckException`)
* A GPU falls off the bus (XID 79)
Check the Alerts Overview dashboard for alert history on the node, or GPU Nodes for ECC counters and XID errors.
### Commands from your Slurm login
Run these from the environment where you submit jobs:
```txt theme={null}
tenant:slurm_nodes:assigned{cluster="$cluster"}
tenant:slurm_nodes:ready{cluster="$cluster"}
tenant:slurm_nodes:bad{cluster="$cluster"}
```
## Common scenarios
### Job stuck in PENDING
Check available capacity:
```txt theme={null}
tenant:slurm_nodes:ready{cluster="$cluster"}
```
If `ready` equals `assigned`, all nodes are available and the issue is likely scheduling constraints: partition, features, or resource request. From your Slurm login shell:
```bash theme={null}
squeue --me --long
scontrol show job $JOBID
```
If `ready` \< `assigned`, some nodes are drained or unhealthy. Check GPU Nodes dashboard to identify which nodes are affected.
### Job running but slow
1. Check GPU utilization on the job's nodes:
```txt theme={null}
DCGM_FI_DEV_GPU_UTIL{cluster="$cluster", node=~"$slurm_nodes"}
```
2. Compare GPUs within the same node. One GPU significantly lower than siblings suggests a hardware issue: ECC errors, thermal throttle, or NVLink degradation.
3. Check for asymmetric performance across nodes in a multi-node job:
```txt theme={null}
avg by (node) (DCGM_FI_DEV_GPU_UTIL{cluster="$cluster", node=~"$slurm_nodes"})
```
A straggler node drags down the entire distributed job. If one node is consistently 20%+ lower than peers, check its ECC status and thermals.
### Node drained unexpectedly
Nodes are automatically drained when:
* Uncorrectable ECC errors are detected (`GPUUncorrectableEccErrors`)
* A critical XID error appears in host diagnostics (`GpuCriticalXid`)
* A machine check exception occurs (`MachineCheckException`)
* A GPU falls off the bus (XID 79)
Check the Alerts Overview dashboard for alert history on the node, or GPU Nodes for ECC counters and XID errors.
### Commands from your Slurm login
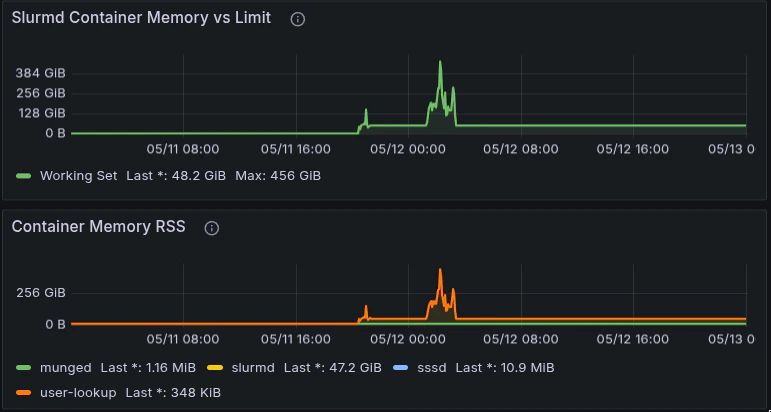
Run these from the environment where you submit jobs:
 ```bash theme={null}
squeue --long
sinfo --long
scontrol show job $JOBID -dd
sacct -j $JOBID --format=JobID,JobName,State,ExitCode,Elapsed,NodeList,AllocGRES
scontrol show node $NODENAME
```
Use `scontrol show job -dd` to see exact GPU index allocation (for example, `GRES=gpu:h100:1(IDX:4)`). Pair that output with GPU utilization panels in Grafana while you debug a job.
```bash theme={null}
squeue --long
sinfo --long
scontrol show job $JOBID -dd
sacct -j $JOBID --format=JobID,JobName,State,ExitCode,Elapsed,NodeList,AllocGRES
scontrol show node $NODENAME
```
Use `scontrol show job -dd` to see exact GPU index allocation (for example, `GRES=gpu:h100:1(IDX:4)`). Pair that output with GPU utilization panels in Grafana while you debug a job.