> ## Documentation Index
> Fetch the complete documentation index at: https://docs.andromeda.ai/llms.txt
> Use this file to discover all available pages before exploring further.
# Overview
> Grafana access, metric naming, and permissions.
## Grafana access
Sign in at [grafana.andromedacluster.xyz](https://grafana.andromedacluster.xyz) with Andromeda SSO credentials. The session lands in the **Tenants** org with the **Viewer** role.
Three dashboards are available, pre-filtered to your assigned nodes and namespaces. **You only see metrics and workloads for your organization’s reserved capacity.**
* **GPU Nodes** - GPU utilization, temperature, power, ECC, memory, node CPU/memory
* **Job Analysis** - Slurm job state, GPU/CPU allocation, node mapping
* **Tenant Dashboard** - capacity overview, node readiness, reservation status

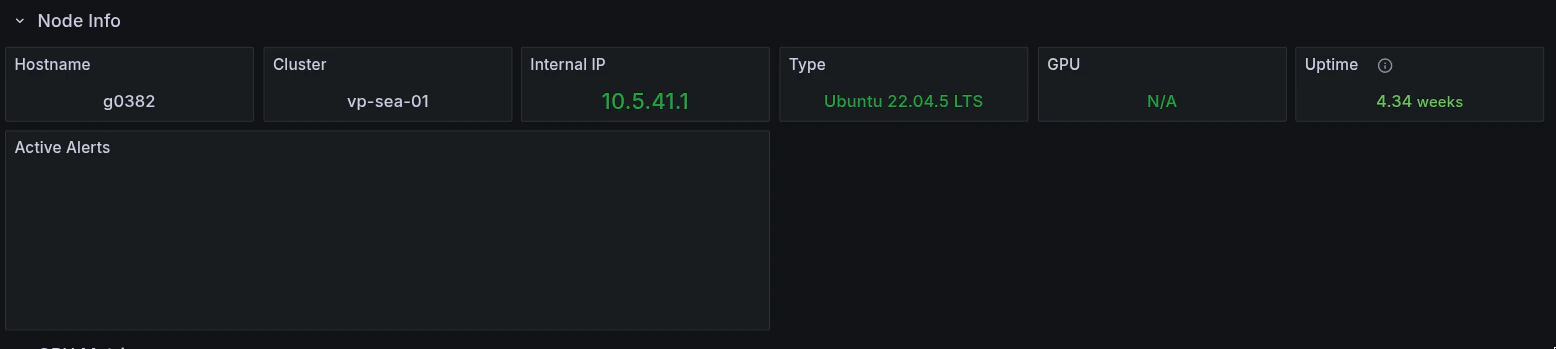 For panel-level detail, see [Dashboards](/monitoring-alerting/dashboards). For custom dashboards, additional metrics, or a direct feed to an external monitoring stack, contact [Andromeda Support](/support).
## Metric naming
Some node-level metrics use a `tenant_` prefix to scope them to your assigned capacity:
| Prefix | Coverage |
| ----------------------- | ------------------------------------------- |
| `tenant_node_*` | CPU, memory, load, pressure, thermals, EDAC |
| `tenant_kube_node_*` | Kubernetes node conditions, cordon state |
| `tenant_weka_*` | Weka storage where deployed |
| `tenant_ib_perfquery_*` | InfiniBand fabric counters |
GPU metrics (`DCGM_FI_*`), container metrics, and Slurm metrics use their standard names and are already scoped by namespace and node assignment. Full list in [Metrics Reference](/monitoring-alerting/metrics).
For panel-level detail, see [Dashboards](/monitoring-alerting/dashboards). For custom dashboards, additional metrics, or a direct feed to an external monitoring stack, contact [Andromeda Support](/support).
## Metric naming
Some node-level metrics use a `tenant_` prefix to scope them to your assigned capacity:
| Prefix | Coverage |
| ----------------------- | ------------------------------------------- |
| `tenant_node_*` | CPU, memory, load, pressure, thermals, EDAC |
| `tenant_kube_node_*` | Kubernetes node conditions, cordon state |
| `tenant_weka_*` | Weka storage where deployed |
| `tenant_ib_perfquery_*` | InfiniBand fabric counters |
GPU metrics (`DCGM_FI_*`), container metrics, and Slurm metrics use their standard names and are already scoped by namespace and node assignment. Full list in [Metrics Reference](/monitoring-alerting/metrics).
 ## Permissions
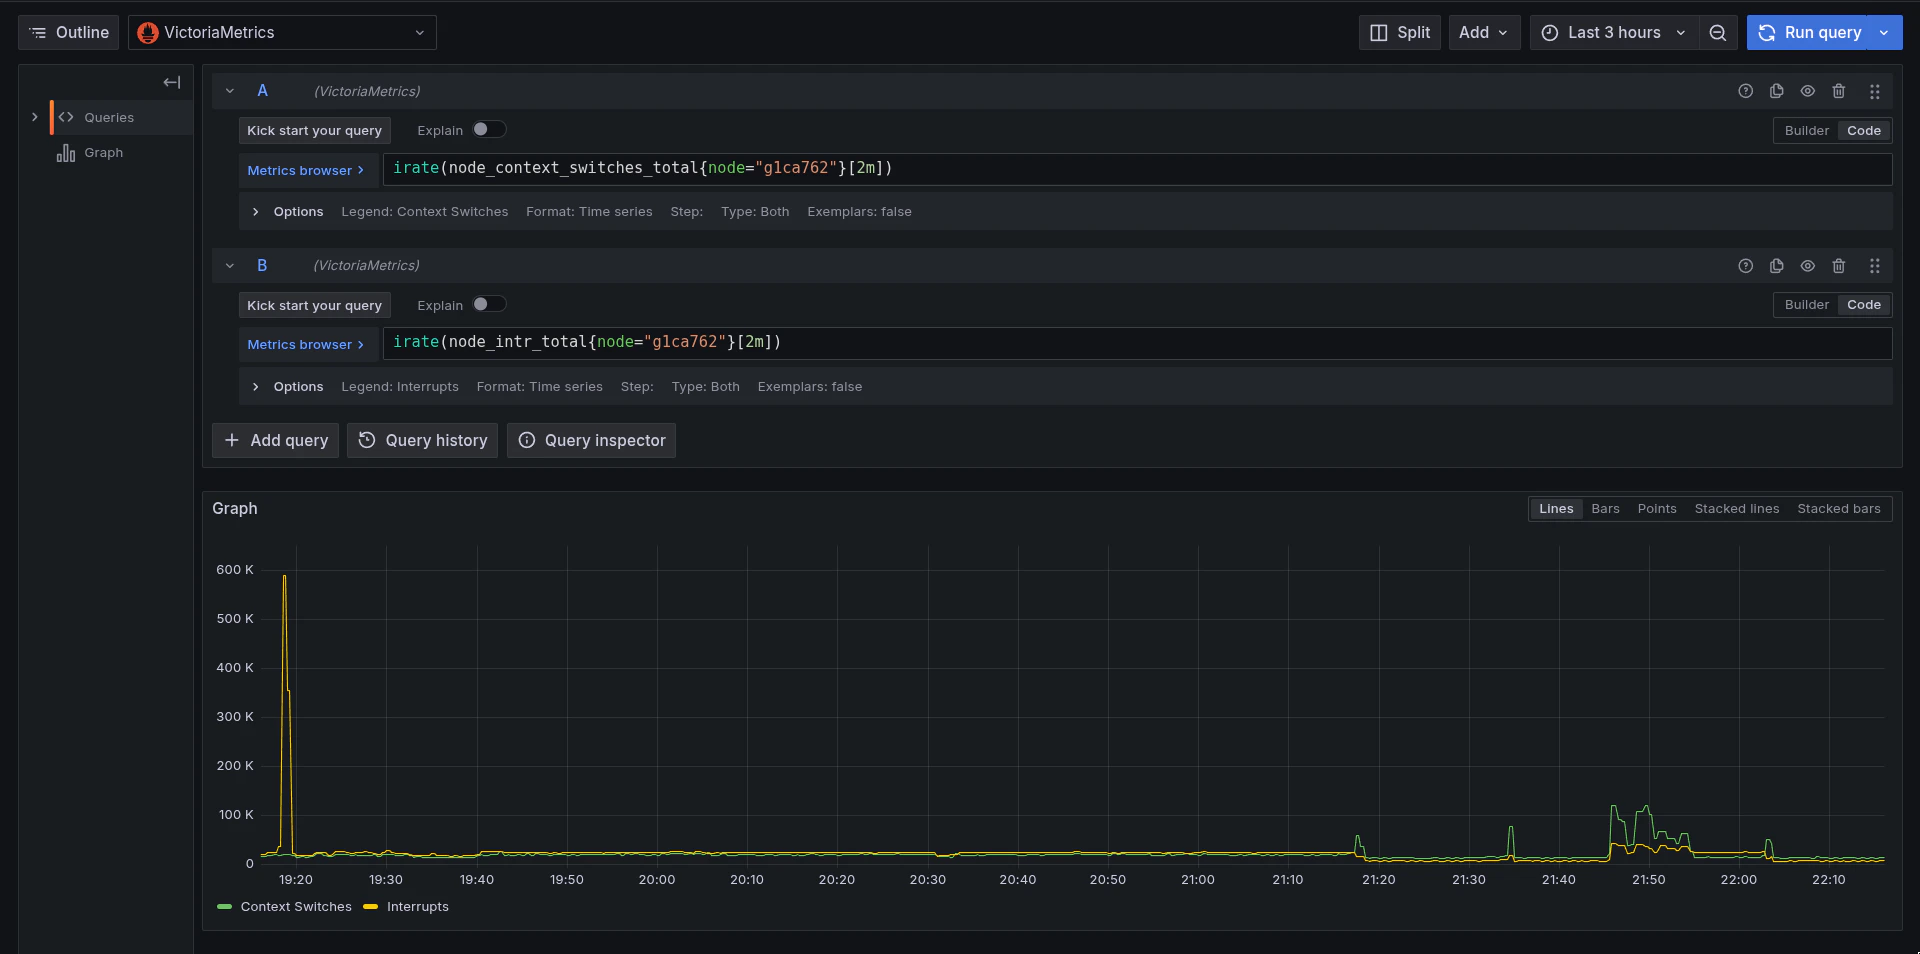
Pre-built dashboards are read-only for all users. Your team can ask [Andromeda Support](/support) to enable ad-hoc **Explore** queries or dashboard editing when you need those capabilities.
| Action | Allowed |
| ----------------------------------- | ---------------------------------------------- |
| View pre-built dashboards | Yes |
| Use Explore, ad-hoc queries | No |
| Create, edit, or delete dashboards | No, planned |
| Query raw `node_*` or `kube_node_*` | No, use `tenant_node_*` / `tenant_kube_node_*` |
## Permissions
Pre-built dashboards are read-only for all users. Your team can ask [Andromeda Support](/support) to enable ad-hoc **Explore** queries or dashboard editing when you need those capabilities.
| Action | Allowed |
| ----------------------------------- | ---------------------------------------------- |
| View pre-built dashboards | Yes |
| Use Explore, ad-hoc queries | No |
| Create, edit, or delete dashboards | No, planned |
| Query raw `node_*` or `kube_node_*` | No, use `tenant_node_*` / `tenant_kube_node_*` |