> ## Documentation Index
> Fetch the complete documentation index at: https://docs.andromeda.ai/llms.txt
> Use this file to discover all available pages before exploring further.
# Dashboards
> Dashboard contents, panels, and key signals.
All dashboards are pre-filtered to your assigned nodes and namespaces. Use the cluster and node dropdowns at the top of each dashboard to narrow scope.
## GPU Nodes
The primary hardware health view. Start here when investigating GPU issues.
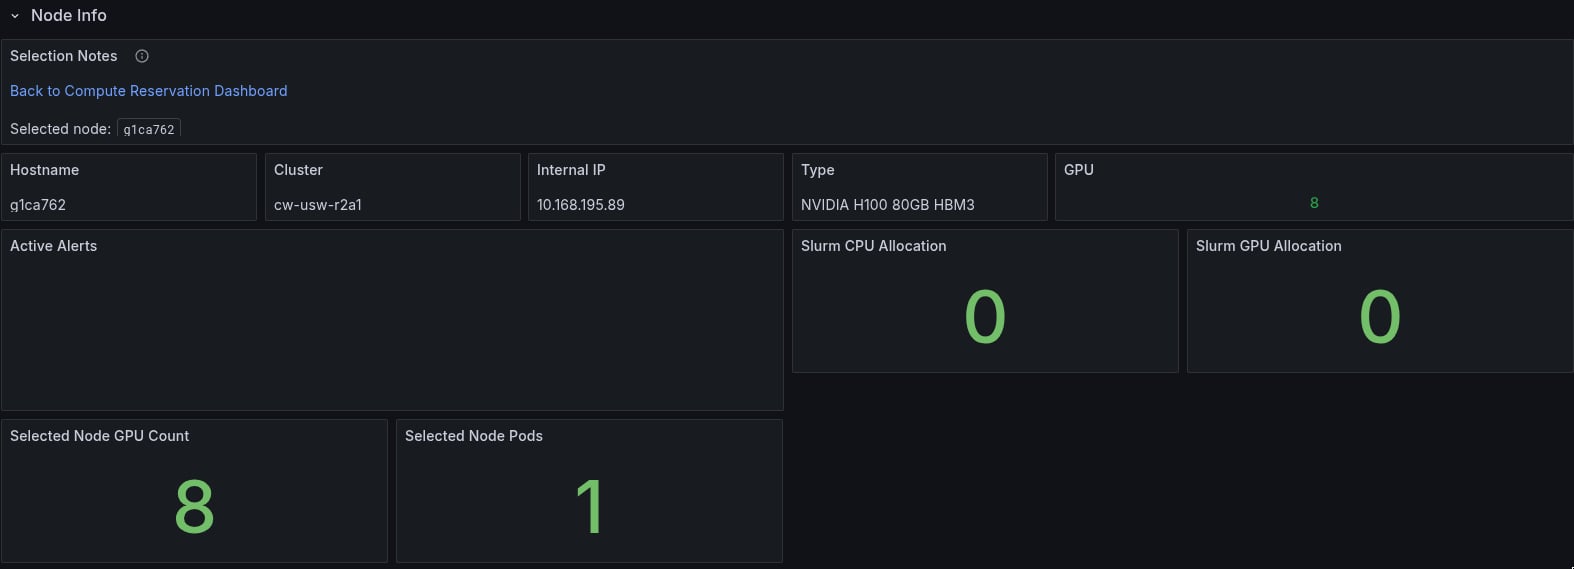
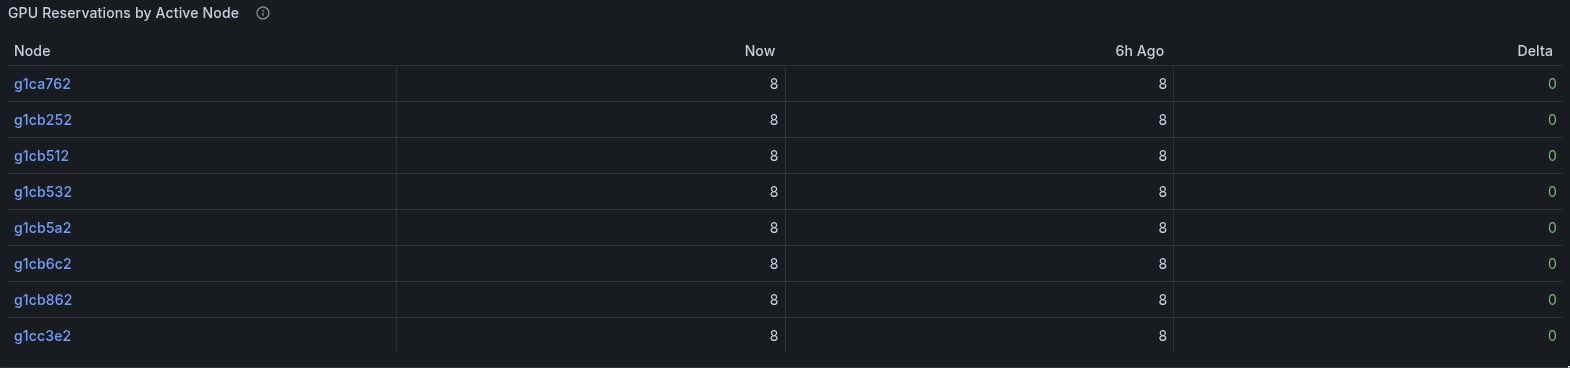
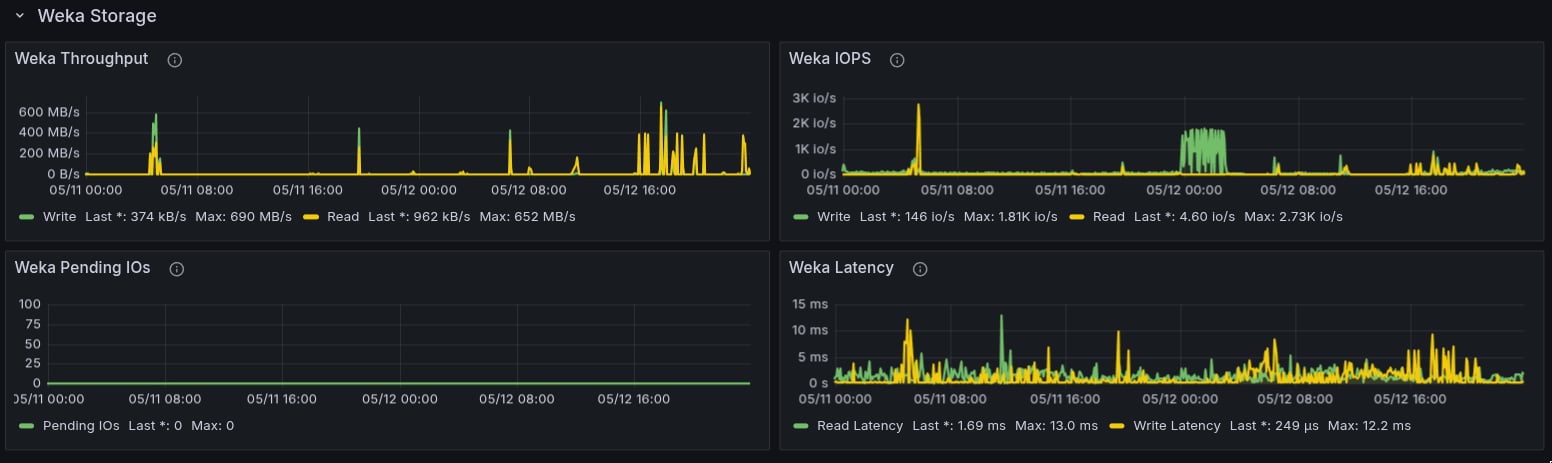
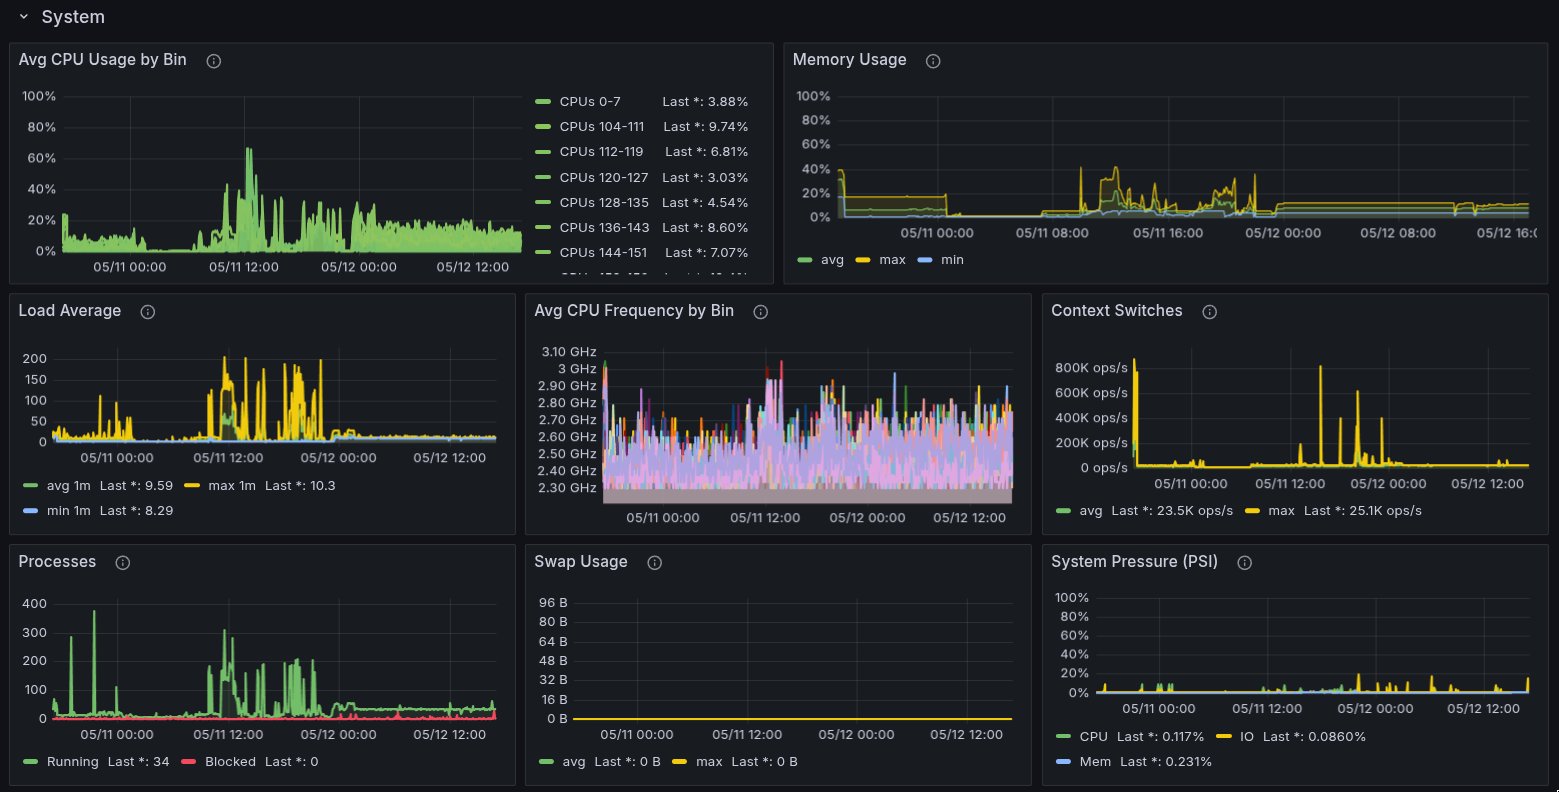 | Panel | Metric | Interpretation |
| ------------------------- | --------------------------------------------- | ------------------------------------------------------------------------------------------------------------------------ |
| GPU Utilization | `DCGM_FI_DEV_GPU_UTIL` | Sustained low utilization during active training suggests a bottleneck elsewhere, such as data loading, CPU, or network. |
| GPU Memory Used | `DCGM_FI_DEV_FB_USED` / `DCGM_FI_DEV_FB_FREE` | OOM risk when used approaches total framebuffer. |
| GPU Temperature | `DCGM_FI_DEV_GPU_TEMP` | Throttling starts above 83 °C. |
| GPU Memory Temperature | `DCGM_FI_DEV_MEMORY_TEMP` | HBM thermal throttle above 95 °C. |
| GPU Power | `DCGM_FI_DEV_POWER_USAGE` | Compare against TDP. Sustained low power plus low utilization means idle GPUs. |
| ECC Errors, uncorrectable | `DCGM_FI_DEV_ECC_DBE_AGG_TOTAL` | Any nonzero value indicates a faulty GPU. Triggers alerts. |
| ECC Errors, correctable | `DCGM_FI_DEV_ECC_SBE_AGG_TOTAL` | Normal at low rates. Burst rates above 10/hr indicate degradation. |
| Row Remapping | `DCGM_FI_DEV_ROW_REMAP_FAILURE` | Nonzero means remapping failed and GPU replacement is needed. |
| XID Errors | `DCGM_FI_DEV_XID_ERRORS` | The XID code identifies the fault type. See [Troubleshooting](/monitoring-alerting/troubleshooting#xid-errors). |
| NVLink Errors | `DCGM_FI_DEV_GPU_NVLINK_ERRORS` | Any increase indicates inter-GPU link degradation. |
| PCIe Replay | `DCGM_FI_DEV_PCIE_REPLAY_COUNTER` | More than 50 in 15 minutes suggests PCIe link instability. |
| Node CPU | `tenant_node_cpu_*` aggregated | Per-NUMA CPU utilization. Data loading bottlenecks surface here. |
| Node Memory | `tenant_node_memory_MemAvailable_bytes` | Low available memory can cause OOM kills. |
## Job Analysis
Maps Slurm jobs to nodes and GPUs.
| Panel | Metric | Interpretation |
| ------------------------- | --------------------------------------------- | ------------------------------------------------------------------------------------------------------------------------ |
| GPU Utilization | `DCGM_FI_DEV_GPU_UTIL` | Sustained low utilization during active training suggests a bottleneck elsewhere, such as data loading, CPU, or network. |
| GPU Memory Used | `DCGM_FI_DEV_FB_USED` / `DCGM_FI_DEV_FB_FREE` | OOM risk when used approaches total framebuffer. |
| GPU Temperature | `DCGM_FI_DEV_GPU_TEMP` | Throttling starts above 83 °C. |
| GPU Memory Temperature | `DCGM_FI_DEV_MEMORY_TEMP` | HBM thermal throttle above 95 °C. |
| GPU Power | `DCGM_FI_DEV_POWER_USAGE` | Compare against TDP. Sustained low power plus low utilization means idle GPUs. |
| ECC Errors, uncorrectable | `DCGM_FI_DEV_ECC_DBE_AGG_TOTAL` | Any nonzero value indicates a faulty GPU. Triggers alerts. |
| ECC Errors, correctable | `DCGM_FI_DEV_ECC_SBE_AGG_TOTAL` | Normal at low rates. Burst rates above 10/hr indicate degradation. |
| Row Remapping | `DCGM_FI_DEV_ROW_REMAP_FAILURE` | Nonzero means remapping failed and GPU replacement is needed. |
| XID Errors | `DCGM_FI_DEV_XID_ERRORS` | The XID code identifies the fault type. See [Troubleshooting](/monitoring-alerting/troubleshooting#xid-errors). |
| NVLink Errors | `DCGM_FI_DEV_GPU_NVLINK_ERRORS` | Any increase indicates inter-GPU link degradation. |
| PCIe Replay | `DCGM_FI_DEV_PCIE_REPLAY_COUNTER` | More than 50 in 15 minutes suggests PCIe link instability. |
| Node CPU | `tenant_node_cpu_*` aggregated | Per-NUMA CPU utilization. Data loading bottlenecks surface here. |
| Node Memory | `tenant_node_memory_MemAvailable_bytes` | Low available memory can cause OOM kills. |
## Job Analysis
Maps Slurm jobs to nodes and GPUs.
 | Panel | Metric | Interpretation |
| --------------- | ------------------------------------------ | ---------------------------------------------------------------------------------------- |
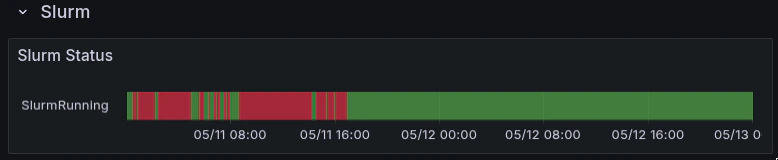
| Job State | `slurm_job_state` | Running, Pending, Failed, Completing. Stuck Pending jobs may indicate scheduling issues. |
| GPUs Allocated | `slurm_job_gpus_allocated` | Per-node GPU count for the job. |
| CPUs Allocated | `slurm_job_cpus_allocated` | Per-node CPU count. |
| Allocated Nodes | `slurm_job_cpus_allocated` by `node` label | Which Slurm nodes the job landed on. |
`slurm_job_state` does not carry a per-node `node` label. For node-level detail, use `slurm_job_cpus_allocated` or `slurm_job_gpus_allocated`, which include node labels.
Slurm node names such as `h200-reserved-145-019` differ from Kubernetes hostnames such as `andromeda25-wk45`. The dashboards handle this join automatically. For custom queries, see [Troubleshooting](/monitoring-alerting/troubleshooting#slurm-to-kubernetes-node-mapping).
## Tenant Dashboard
Capacity and readiness overview.
| Panel | Metric | Interpretation |
| --------------- | ------------------------------------------ | ---------------------------------------------------------------------------------------- |
| Job State | `slurm_job_state` | Running, Pending, Failed, Completing. Stuck Pending jobs may indicate scheduling issues. |
| GPUs Allocated | `slurm_job_gpus_allocated` | Per-node GPU count for the job. |
| CPUs Allocated | `slurm_job_cpus_allocated` | Per-node CPU count. |
| Allocated Nodes | `slurm_job_cpus_allocated` by `node` label | Which Slurm nodes the job landed on. |
`slurm_job_state` does not carry a per-node `node` label. For node-level detail, use `slurm_job_cpus_allocated` or `slurm_job_gpus_allocated`, which include node labels.
Slurm node names such as `h200-reserved-145-019` differ from Kubernetes hostnames such as `andromeda25-wk45`. The dashboards handle this join automatically. For custom queries, see [Troubleshooting](/monitoring-alerting/troubleshooting#slurm-to-kubernetes-node-mapping).
## Tenant Dashboard
Capacity and readiness overview.
 | Panel | Metric | Interpretation |
| -------------------- | ----------------------------- | ----------------------------------------------- |
| Nodes Assigned | `tenant:slurm_nodes:assigned` | Total nodes assigned to your environment. |
| Nodes Ready | `tenant:slurm_nodes:ready` | Nodes that are schedulable and healthy. |
| Nodes degraded | `tenant:slurm_nodes:bad` | Nodes that are drained, not-ready, or degraded. |
| Node Readiness Ratio | `ready / assigned` | Below 100% means some capacity is unavailable. |
When `tenant:slurm_nodes:bad` is nonzero, open the **GPU Nodes** dashboard to identify which specific nodes are affected and why, such as ECC errors, thermal state, cordon, or drain.
| Panel | Metric | Interpretation |
| -------------------- | ----------------------------- | ----------------------------------------------- |
| Nodes Assigned | `tenant:slurm_nodes:assigned` | Total nodes assigned to your environment. |
| Nodes Ready | `tenant:slurm_nodes:ready` | Nodes that are schedulable and healthy. |
| Nodes degraded | `tenant:slurm_nodes:bad` | Nodes that are drained, not-ready, or degraded. |
| Node Readiness Ratio | `ready / assigned` | Below 100% means some capacity is unavailable. |
When `tenant:slurm_nodes:bad` is nonzero, open the **GPU Nodes** dashboard to identify which specific nodes are affected and why, such as ECC errors, thermal state, cordon, or drain.